
When“Positive”and“Negative”Aren’t Enough
Proposing a more clinically useful way to present diagnostic-accuracy studies of tests that produce a score

In my last post about communicating test accuracy to patients, I made a poor choice of example. Trying to avoid more discussion of tuberculosis (TB) tests, I chose a test for dementia with ordinal results (0–50) and rather glossed over the fact that the authors had used standard methods to identify an optimal cut-off score of 42, meaning the test was positive if <42 and negative if >42. This was clumsy. Clearly, turning a score between 0 and 50 into a binary outcome loses information. The implications of a score of 0 is likely very different from a score of 41. There is a long history of discussing this issue (here, here , & here for example) and multiple solutions have been proposed to retain important information from the score, but unfortunately these methods are only rarely reported.
Here is a typical example from the TB literature. The Xpert MTB Host Response assay is a blood-based PCR test that produces an ordinal result. Researchers performed a diagnostic accuracy study including 273 participants being investigated for pulmonary TB, of whom 69 had confirmed disease. They primarily report an AUROC of 0.84; at the optimal cut-off, sensitivity is 86% and specificity is 72%. The negative predictive value (NPV) is 94% and the positive predictive value (PPV) is 51%. Below is the ROC curve from the publication, with the AUC and optimal cut-offs added.

The area under the receiver operating characteristic (AUROC) curve summarises how well the test discriminates between people with and without disease, where 1.0 represents perfect discrimination and 0.5 represents no discrimination. An optimal cut-off for the score (as in the dementia test) has been calculated using the Youden index: the maximum value of sensitivity + specificity − 1 along the ROC curve. The sensitivity, specificity and predictive values are then calculated at that cut-off.
What am I as a clinician to make of this new test? The authors conclude that the negative predictive value is “high” and that the assay is a promising rule-out test. Should I exclude TB in patients who have a negative test? What should I do with patients with a positive test?
As a clinician, my answers are clear: I would not exclude TB at a probability of 6%, nor would I start treatment at a probability of 51%. Given either result, I would want to perform a follow-up test—in this case, sputum testing with a nucleic acid amplification test (NAAT) such as Xpert MTB/RIF. Using the optimal cut-off point, neither the positive nor the negative classification would change my immediate management: I would still request sputum NAAT. The conventional presentation therefore gives me little indication of whether the underlying score might nevertheless be clinically useful.
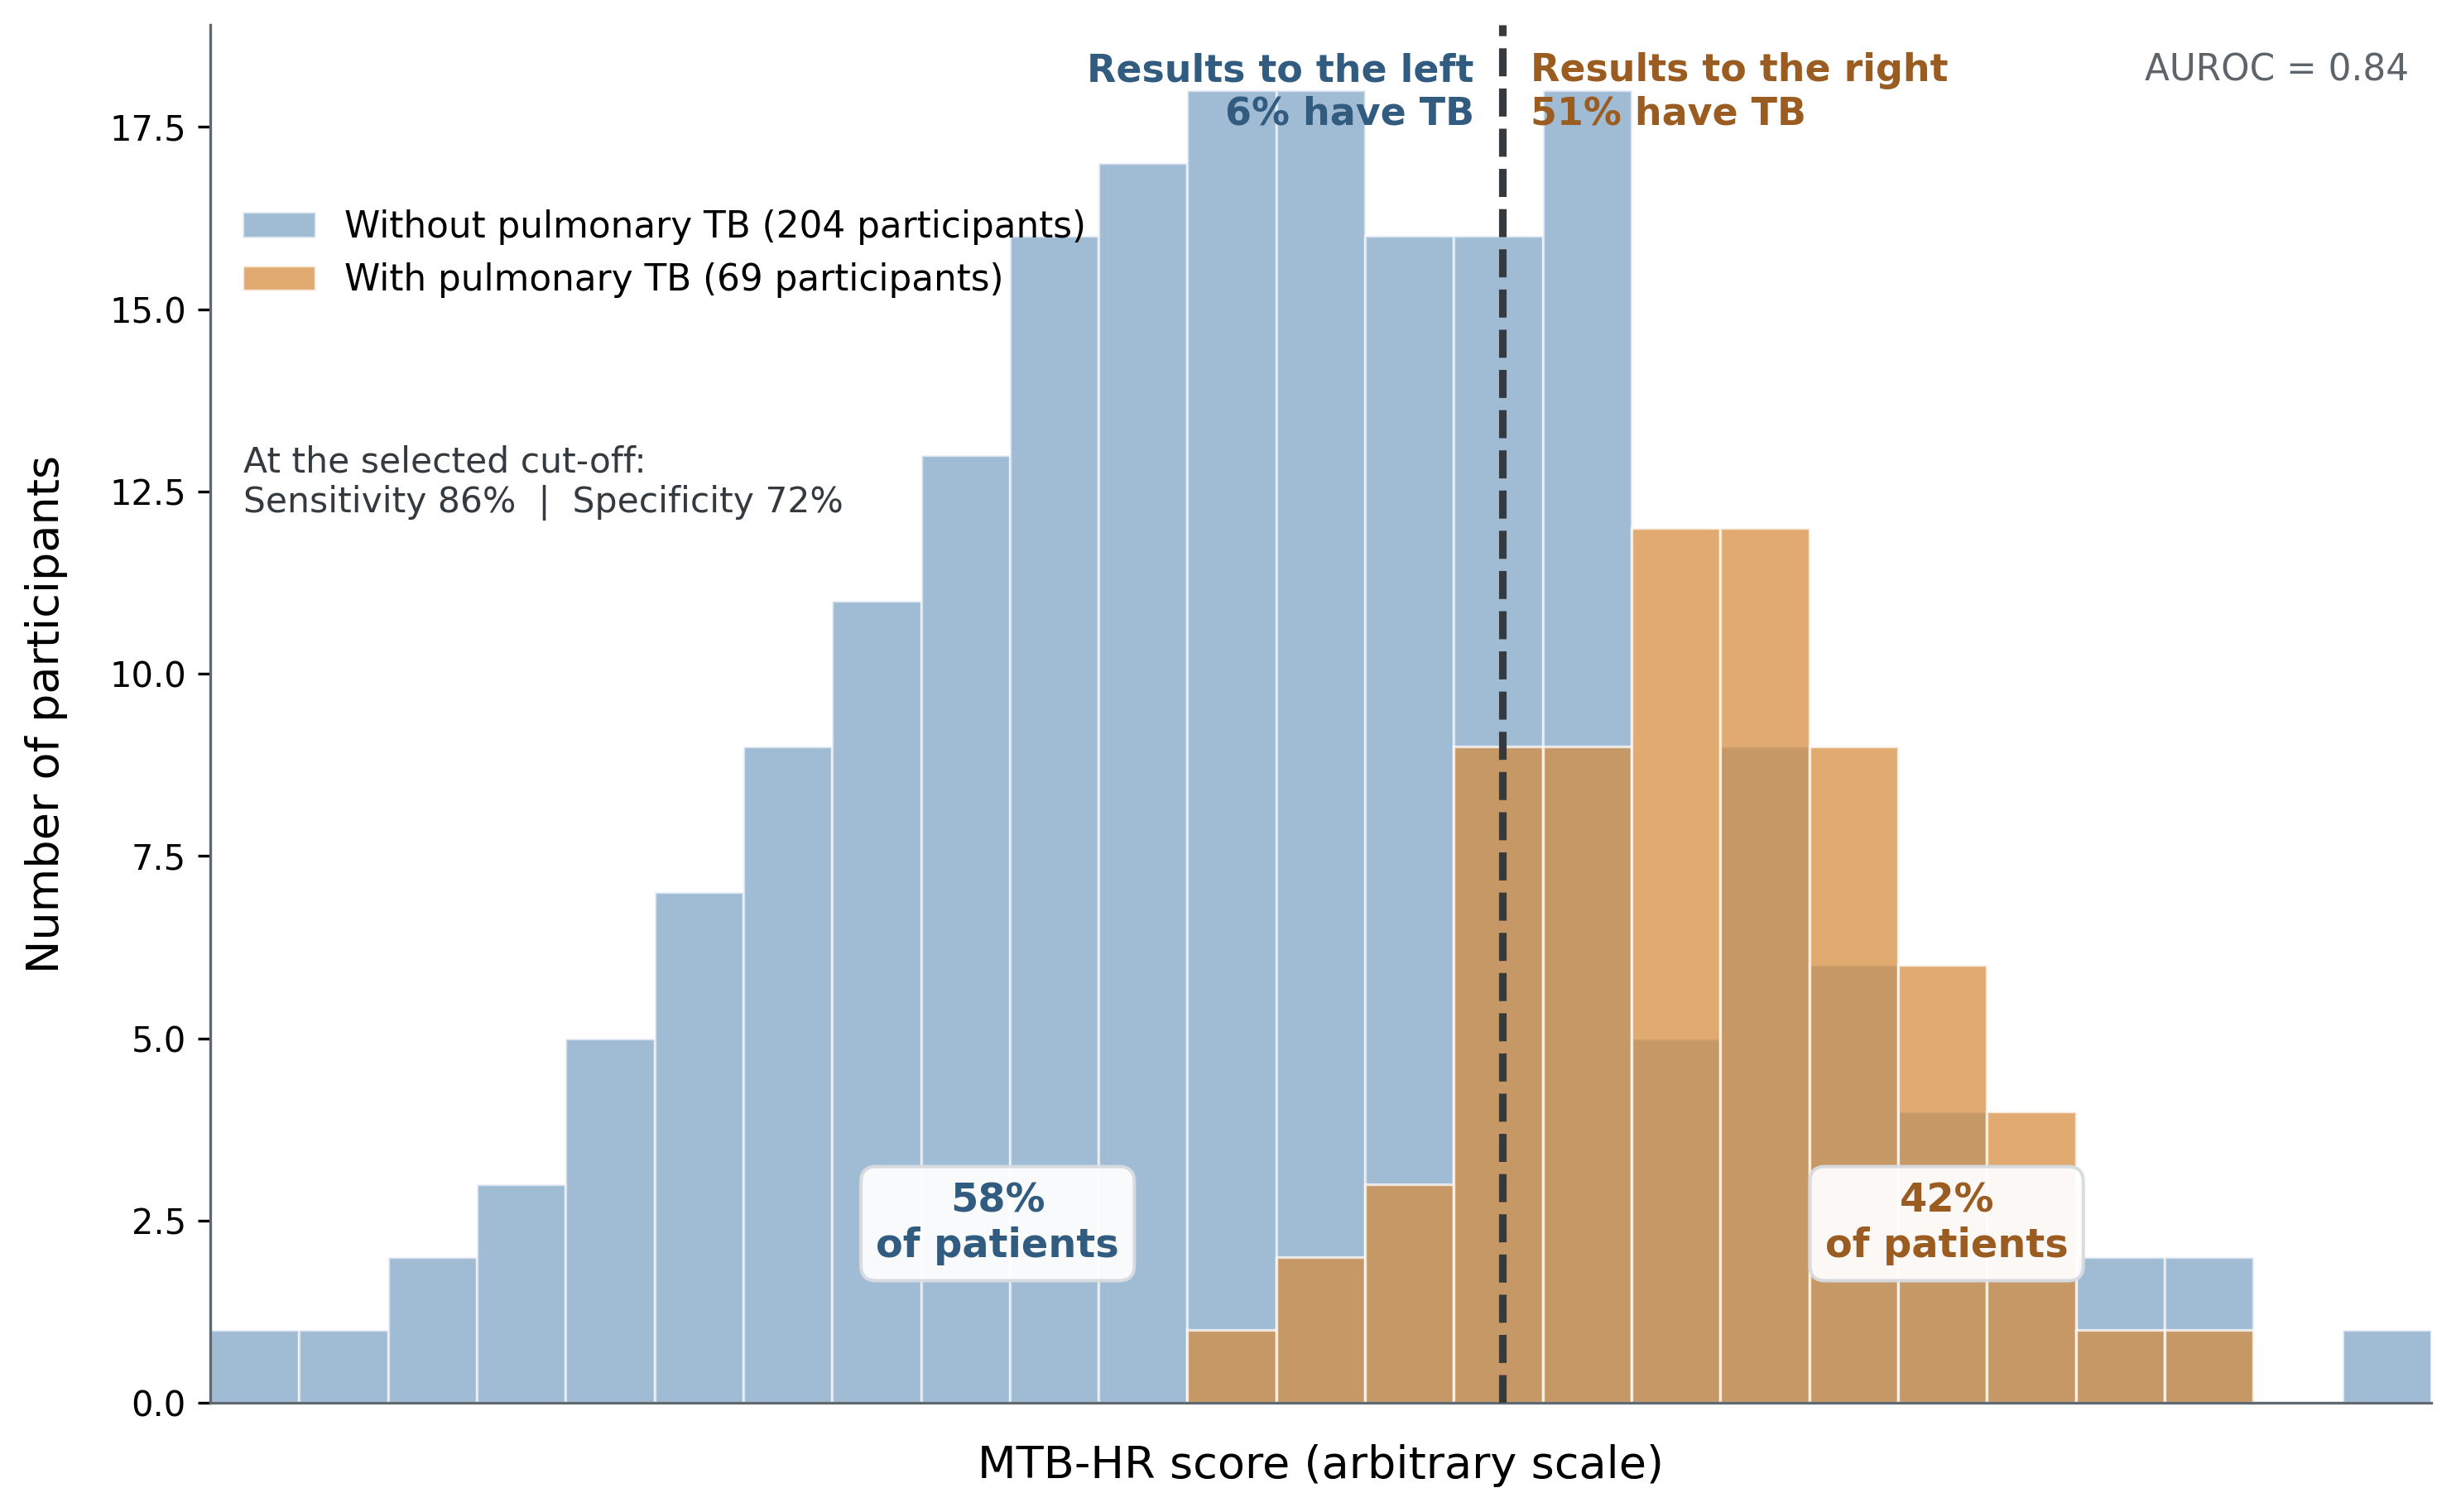
The figure below presents the same data in a slightly different way (the exact participant-level data from the study are not available, so the numbers are approximate). It shows the frequency distribution of scores among participants with and without pulmonary TB. The separation between the distributions illustrates the discrimination summarised by the AUROC, while also showing where participants’ scores lie. I have drawn in the Youden-index optimal cut-off, giving sensitivity of 86% and specificity of 72%. Among people whose scores lie to the left of the line, 6% have TB (equivalent to 1 − NPV); among those whose scores lie to the right, 51% have TB (the PPV). You can also see that 58% of participants lie to the left of the line and 42% to the right.
However, all is not lost: we still have the information contained in the actual score. While many people have discussed how to use such data, my proposal is a simple update to the way they are presented. I propose that we first agree on the test and test/treatment thresholds for the decision to perform sputum NAAT. These thresholds were described by Pauker and Kassirer in 1980. Below the test threshold, the probability is sufficiently low that we would not proceed to sputum NAAT. Above the test/treatment threshold, we would start treatment without waiting for the NAAT result, even if we requested the test to determine drug susceptibility .

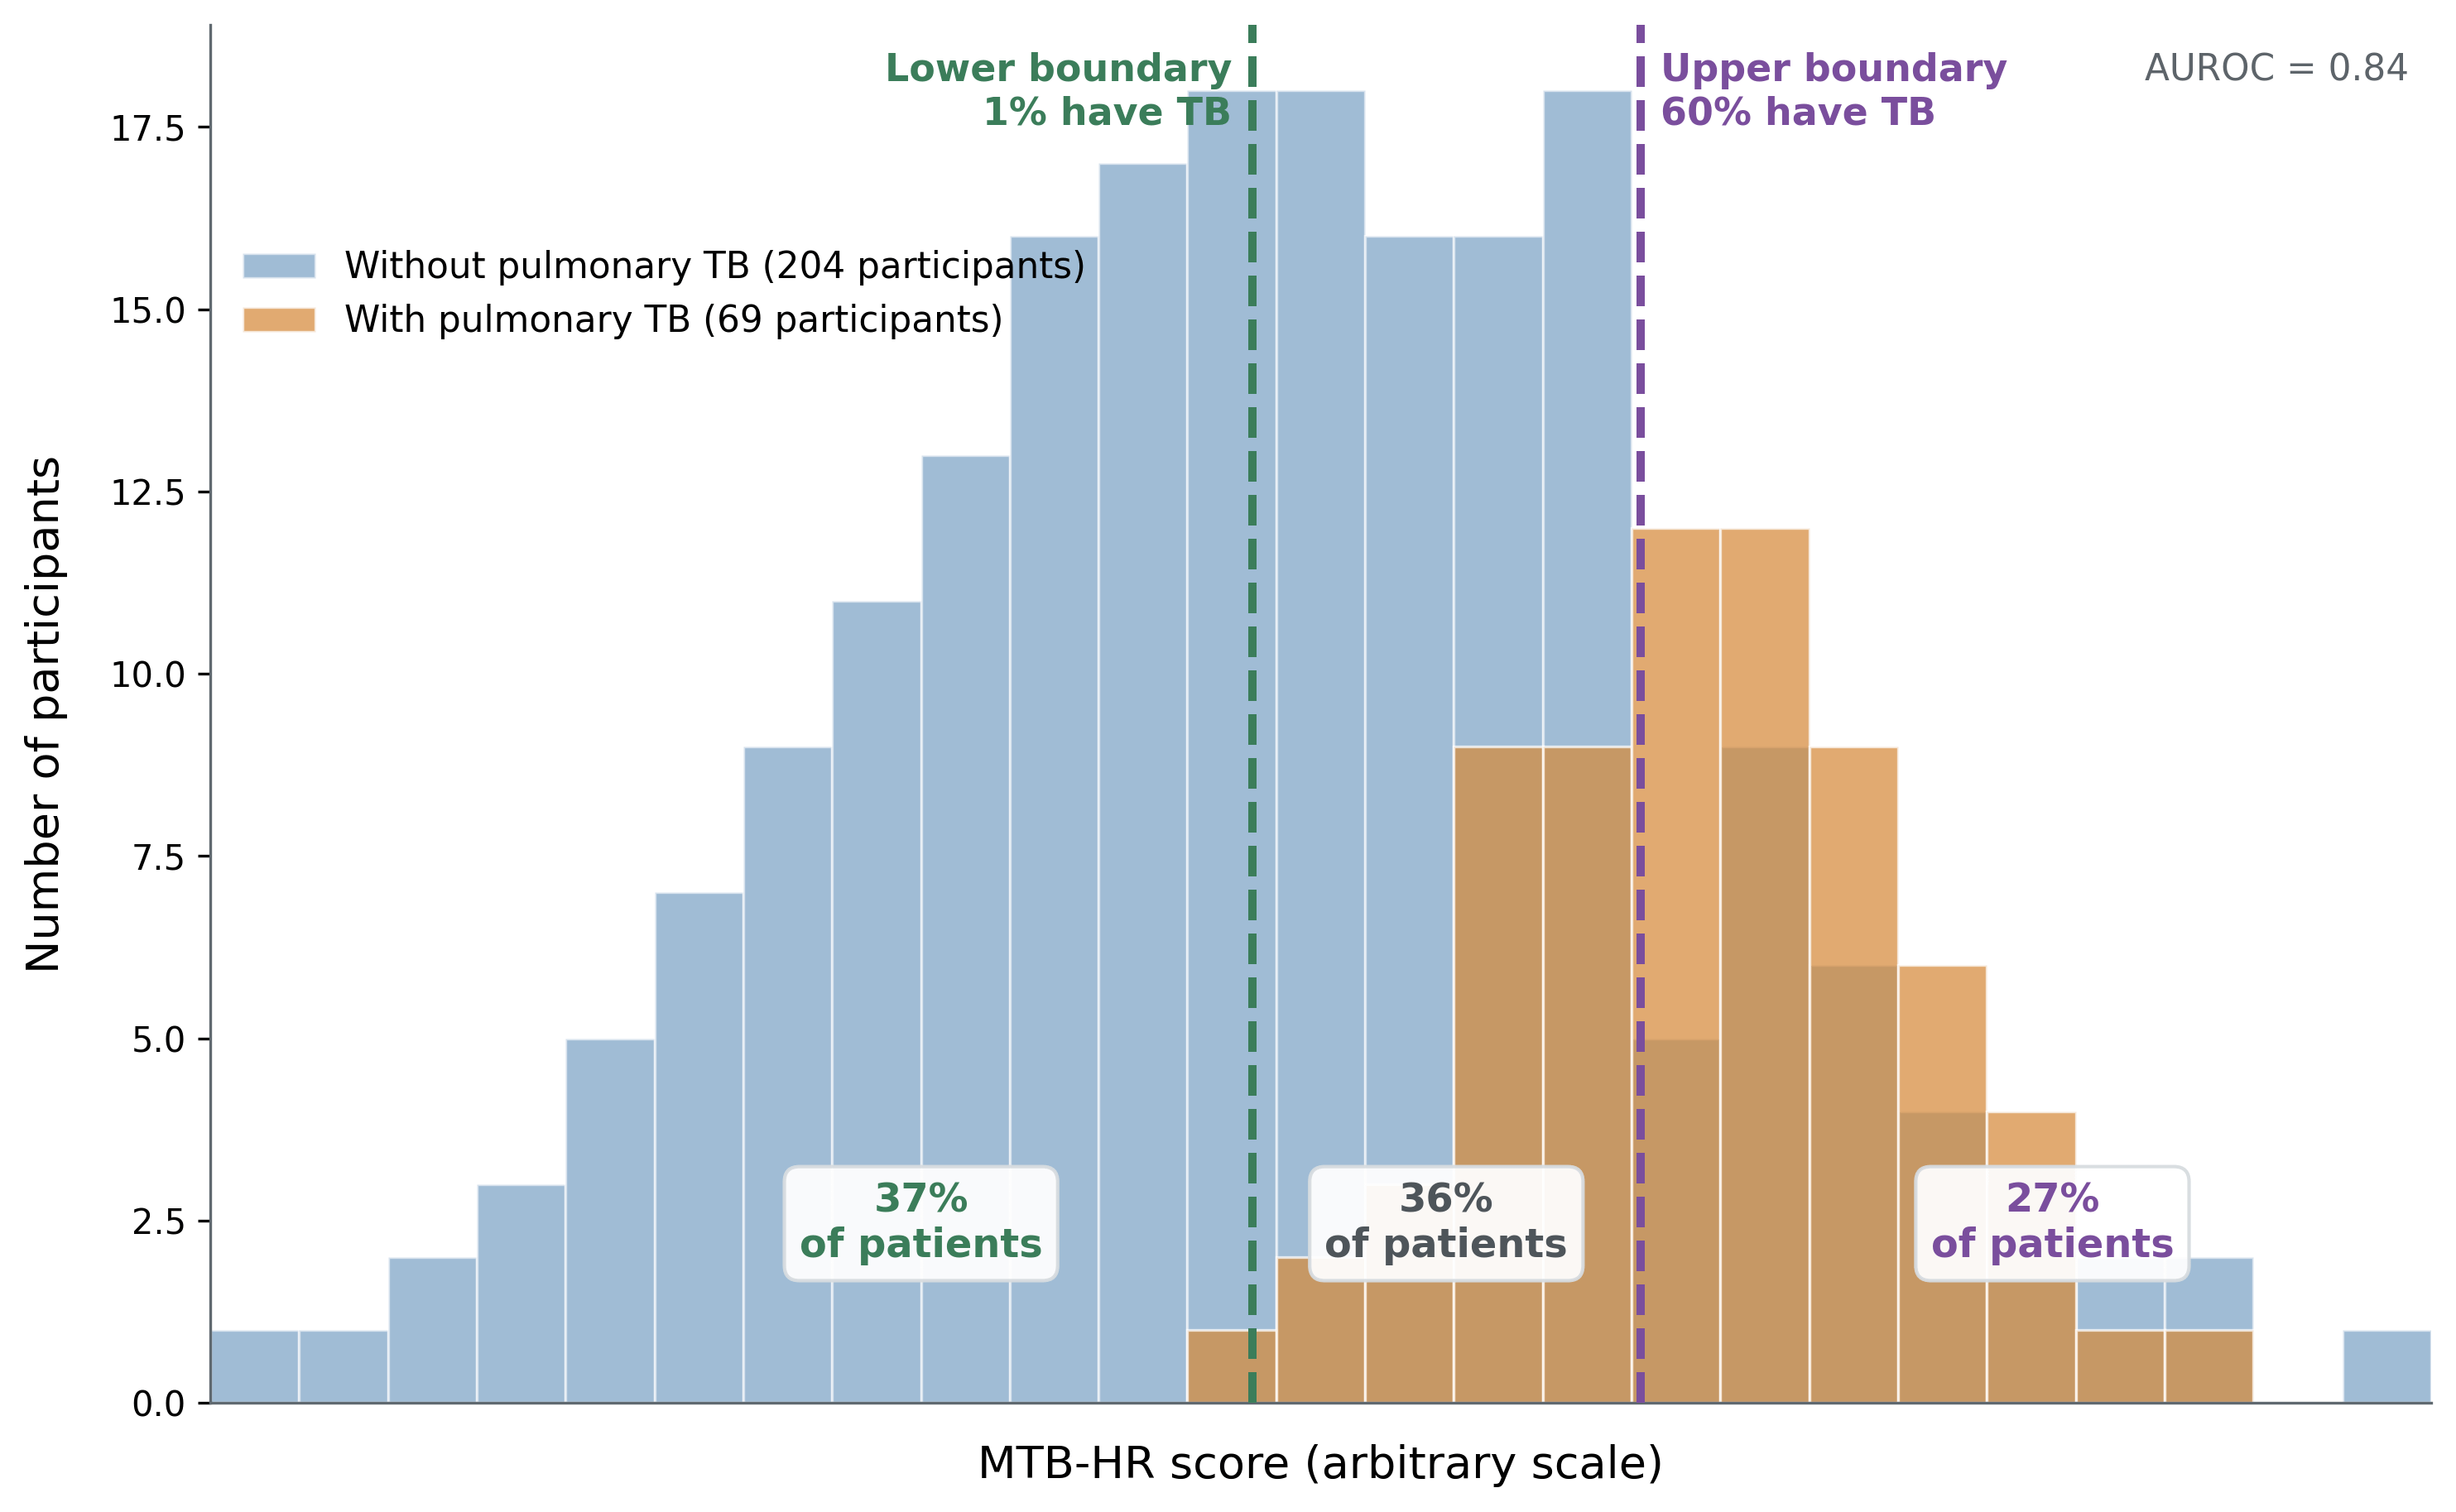
There are many ways of estimating these thresholds, and many factors contribute to the final values, but for illustration I will use 1% and 60%, respectively. In the diagram below, I have plotted the same data but, rather than the single cut-off based on the Youden index, I have added cut-offs relevant to these decision thresholds. Among participants with scores to the left of the lower boundary, 1% have TB and sputum NAAT could be avoided. Among those with scores to the right of the upper boundary, 60% have TB and treatment could be started without waiting for the NAAT result. Participants with scores between the boundaries should proceed to sputum NAAT.
Presented in this way, we could even calculate a decision-change proportion: the number of participants whose immediate management would change, compared with the default strategy of sputum NAAT for everyone, divided by the total number tested.
Suppose 1000 patients undergo MTB-HR testing:
· 370 have a score that would move the probability below 1%
· 270 have a score that would move the probability above 60%
· 360 remain between the thresholds
Decision-change proportion = (370 + 270) ÷ 1000 = 64%
I can anticipate several criticisms of this proposal. First, how would we determine the thresholds? There are multiple possible approaches, but the important thing would be to use thresholds consistently when comparing tests. For example, using my illustrative values, all tests used in comparable outpatient populations being investigated for TB would use the 1% and 60% thresholds. Tests used in other populations would need their own thresholds.
Second, what happens when disease prevalence changes? This is a question for all studies that report predictive values. Quoting a predictive value without stating the prevalence is like quoting a measurement without its units: it’s uninterpretable. Just as predictive values change with prevalence, so would the decision-change proportion. That does not make it a bad way of describing a study. In any case, a study could provide a sensitivity analysis across a range of plausible prevalences.
The study could report:
“At the prevalence observed in this study, fewer than 1% of participants with an MTB-HR score at or below X had pulmonary tuberculosis, while 60% of those with a score at or above Y had pulmonary tuberculosis. Scores between X and Y remained indeterminate and required sputum NAAT.”
It could then tell us how many participants fell into each category:
“The MTB-HR result reduced the probability below 1% in 37% of participants, increased it above 60% in 27%, and left it between the thresholds in 36%.”
These values cannot be recovered from the reported AUC, sensitivity and specificity. They require the distribution of MTB-HR scores among participants with and without pulmonary tuberculosis, ideally using participant-level data.
In conclusion, current reporting of tests with continuous or ordinal results is often clinically unhelpful. I am not proposing a cure-all, but a complementary way of presenting diagnostic-accuracy data: report the score boundaries that cross clinically defined decision thresholds, together with the proportion of participants falling below, between and above them. This would tell clinicians not merely how well a test discriminates, but how often it might actually change what they do.